Physico-Chemical Research Institute
Belarusian State University

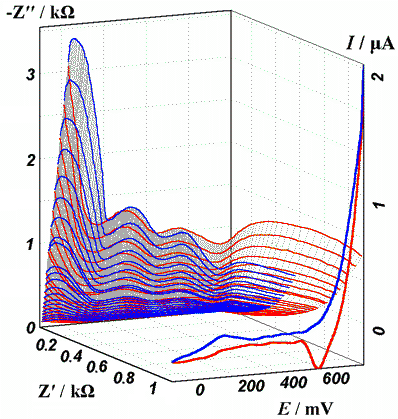
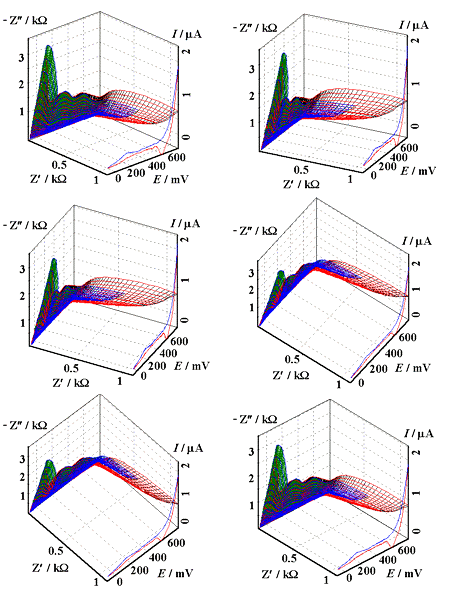
Aniline electropolymerisation gives a conducting polymer polyaniline. The figures in this page show the signatures of ac and dc potentiodynamic responses acquired with potentiodynamic electrochemical impedance spectroscopy in cathodic and anodic scans in the initial and most nonstationary stages of aniline electropolymerisation on gold.


The dc part of the response is represented by the voltammogram in the transparent front facet of the parallelepiped. Red lines characterise the responses in the cathodic scan, and blue lines - in the anodic scan. Different red and blue lines in the 3D PDEIS spectrum correspond to different frequencies. The animation shows the PDEIS spectrum in different perspectives (spectrum rotation in the course of experiment is available in virtual spectrometer through scroll bars). Analysis of the ac response dependence on frequency gives parameters of the underlying processes as functions of variable potential and this enables simultaneous investigation of various interrelated processes (see the article).
Physico-Chemical Research Institute Belarusian State University  |